
Page 97 - Northville Township
P. 97
44.5 Median Age 2.53 Average Household Size
Northville Township residents had a median age of 44.5 The average household size in Northville Township in
years in 2020, which was up from 42.4 years in 2010. 2020 was 2.53 persons, an increase from an average
This aligns with the reduced percentage of residents of 2.47 people in 2010. Over this 10-year period, the
under age 18 — 21.6% in 2020 versus 24% in 2010. This characteristics of household composition also changed,
increase in the Township’s median age also mirrors state with an increased percentage of houses with seniors
and national trends as the graying of the Baby Boomer age 65+ and of 2+ person households without children.
Generation continues. (Source: U.S. Census Bureau) The percentage of households without seniors, and
households with a person under 65 who lived alone,
also decreased during this 10-year period. (Sources: U.S.
72.7 Age Dependency Ratio Census Bureau and SEMCOG)
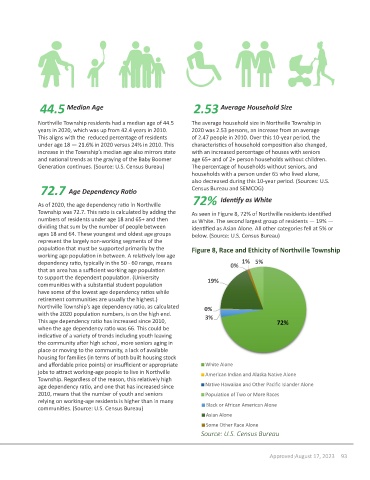
As of 2020, the age dependency ratio in Northville 72% Identify as White
Township was 72.7. This ratio is calculated by adding the As seen in Figure 8, 72% of Northville residents identified
numbers of residents under age 18 and 65+ and then as White. The second largest group of residents — 19% —
dividing that sum by the number of people between identified as Asian Alone. All other categories fell at 5% or
ages 18 and 64. These youngest and oldest age groups below. (Source: U.S. Census Bureau)
represent the largely non-working segments of the
population that must be supported primarily by the Figure 8, Race and Ethicity of Northville Township
Race and Ethnicity
working age population in between. A relatively low age Race and Ethnicity
dependency ratio, typically in the 50 - 60 range, means 0% 1% 5% 0% 1% 5%
that an area has a sufficient working age population
to support the dependent population. (University 19%
communities with a substantial student population 19%
Race and Ethnicity
have some of the lowest age dependency ratios while
retirement communities are usually the highest.) 1% 5%
0%
Northville Township’s age dependency ratio, as calculated 0% 0%
with the 2020 population numbers, is on the high end. 3%
This age dependency ratio has increased since 2010, 3% 72% 72%
19%
when the age dependency ratio was 66. This could be
indicative of a variety of trends including youth leaving
the community after high school, more seniors aging in
0%
place or moving to the community, a lack of available
housing for families (in terms of both built housing stock
3%
White alone
White Alone
Black or African American Alone
and affordable price points) or insufficient or appropriate 72% Black or African American Alone
jobs to attract working-age people to live in Northville American Indian and Alaska Native Alone Asian Alone
American Indian and Alaska Native Alone
Asian Alone
Township. Regardless of the reason, this relatively high
Native Hawaiian and Other Pacific Islander Alone
Some Other Race Alone
age dependency ratio, and one that has increased since Native Hawaiian and Other Pacific Islander Alone Some Other Race Alone
2010, means that the number of youth and seniors Population of Two or More Races
Population of Two or More Races
relying on working-age residents is higher than in many Black or African American Alone
White alone
communities. (Source: U.S. Census Bureau)
American Indian and Alaska Native Alone Asian Alone
Native Hawaiian and Other Pacific Islander Alone Some Other Race Alone
Population of Two or More Races Source: U.S. Census Bureau
Approved August 17, 2023 93