
Page 204 - Littleton, CO Comprehensive Plan
P. 204
Fiscal Impact Analysis
The City of Littleton, CO
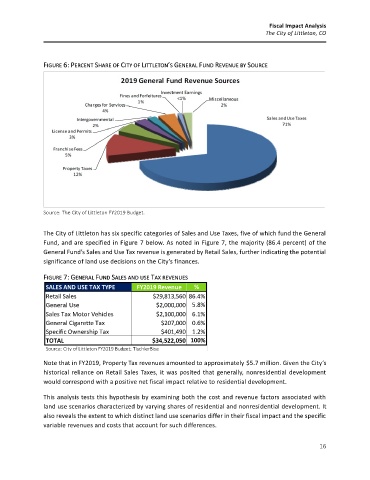
FIGURE 6: PERCENT SHARE OF CITY OF LITTLETON’S GENERAL FUND REVENUE BY SOURCE
Source: The City of Littleton FY2019 Budget.
The City of Littleton has six specific categories of Sales and Use Taxes, five of which fund the General
Fund, and are specified in Figure 7 below. As noted in Figure 7, the majority (86.4 percent) of the
General Fund’s Sales and Use Tax revenue is generated by Retail Sales, further indicating the potential
significance of land use decisions on the City’s finances.
FIGURE 7: GENERAL FUND SALES AND USE TAX REVENUES
SALES AND USE TAX TYPE FY2019 Revenue %
Retail Sales $29,813,560 86.4%
General Use $2,000,000 5.8%
Sales Tax Motor Vehicles $2,100,000 6.1%
General Cigarette Tax $207,000 0.6%
Specific Ownership Tax $401,490 1.2%
TOTAL $34,522,050 100%
Source: City of Littleton FY2019 Budget; TischlerBise
Note that in FY2019, Property Tax revenues amounted to approximately $5.7 million. Given the City’s
historical reliance on Retail Sales Taxes, it was posited that generally, nonresidential development
would correspond with a positive net fiscal impact relative to residential development.
This analysis tests this hypothesis by examining both the cost and revenue factors associated with
land use scenarios characterized by varying shares of residential and nonresidential development. It
also reveals the extent to which distinct land use scenarios differ in their fiscal impact and the specific
variable revenues and costs that account for such differences.
16