
Page 202 - Littleton, CO Comprehensive Plan
P. 202
Fiscal Impact Analysis
The City of Littleton, CO
SUMMARY OF PROJECTED GROWTH BY SCENARIO
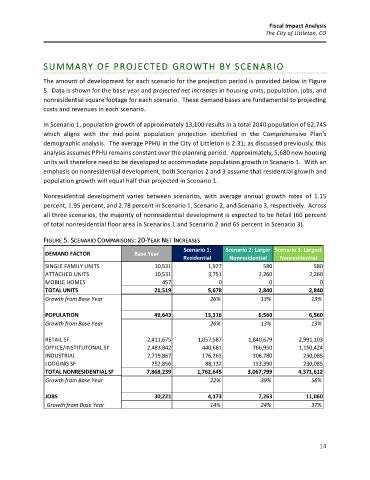
The amount of development for each scenario for the projection period is provided below in Figure
5. Data is shown for the base year and projected net increases in housing units, population, jobs, and
nonresidential square footage for each scenario. These demand bases are fundamental to projecting
costs and revenues in each scenario.
In Scenario 1, population growth of approximately 13,100 results in a total 2040 population of 62,745
which aligns with the mid-point population projection identified in the Comprehensive Plan’s
demographic analysis. The average PPHU in the City of Littleton is 2.31; as discussed previously, this
analysis assumes PPHU remains constant over the planning period. Approximately, 5,680 new housing
units will therefore need to be developed to accommodate population growth in Scenario 1. With an
emphasis on nonresidential development, both Scenarios 2 and 3 assume that residential growth and
population growth will equal half that projected in Scenario 1.
Nonresidential development varies between scenarios, with average annual growth rates of 1.15
percent, 1.95 percent, and 2.78 percent in Scenario 1, Scenario 2, and Scenario 3, respectively. Across
all three scenarios, the majority of nonresidential development is expected to be Retail (60 percent
of total nonresidential floor area in Scenarios 1 and Scenario 2 and 65 percent in Scenario 3).
FIGURE 5. SCENARIO COMPARISONS: 20-YEAR NET INCREASES GROWTH OVER BASE YEAR (2019)
Scenario 1: Scenario 2: Larger Scenario 3: Largest
DEMAND FACTOR Base Year
Residential Nonresidential Nonresidential
SINGLE FAMILY UNITS 10,531 1,927 580 580
ATTACHED UNITS 10,531 3,751 2,260 2,260
MOBILE HOMES 457 0 0 0
TOTAL UNITS 21,519 5,678 2,840 2,840
Growth from Base Year 26% 13% 13%
POPULATION 49,643 13,116 6,560 6,560
Growth from Base Year 26% 13% 13%
RETAIL SF 2,411,675 1,057,587 1,840,679 2,991,103
OFFICE/INSTITUTONAL SF 2,483,842 440,661 766,950 1,150,424
INDUSTRIAL 2,719,867 176,265 306,780 230,085
LODGING SF 252,856 88,132 153,390 230,085
TOTAL NONRESIDENTIAL SF 7,868,239 1,762,645 3,067,799 4,371,612
Growth from Base Year 22% 39% 56%
JOBS 30,221 4,173 7,263 11,060
Growth from Base Year 14% 24% 37%
14