
Page 211 - Littleton, CO Comprehensive Plan
P. 211
Fiscal Impact Analysis
The City of Littleton, CO
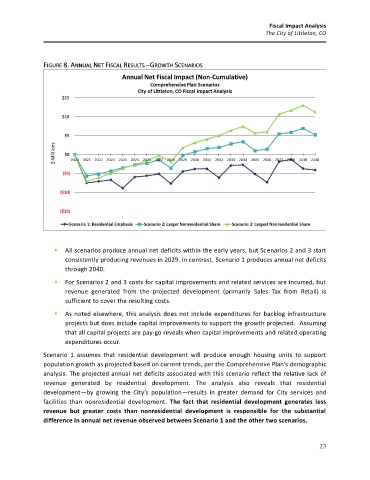
FIGURE 8. ANNUAL NET FISCAL RESULTS –GROWTH SCENARIOS
▪ All scenarios produce annual net deficits within the early years, but Scenarios 2 and 3 start
consistently producing revenues in 2029. In contrast, Scenario 1 produces annual net deficits
through 2040.
▪ For Scenarios 2 and 3 costs for capital improvements and related services are incurred, but
revenue generated from the projected development (primarily Sales Tax from Retail) is
sufficient to cover the resulting costs.
▪ As noted elsewhere, this analysis does not include expenditures for backlog infrastructure
projects but does include capital improvements to support the growth projected. Assuming
that all capital projects are pay-go reveals when capital improvements and related operating
expenditures occur.
Scenario 1 assumes that residential development will produce enough housing units to support
population growth as projected based on current trends, per the Comprehensive Plan’s demographic
analysis. The projected annual net deficits associated with this scenario reflect the relative lack of
revenue generated by residential development. The analysis also reveals that residential
development—by growing the City’s population—results in greater demand for City services and
facilities than nonresidential development. The fact that residential development generates less
revenue but greater costs than nonresidential development is responsible for the substantial
difference in annual net revenue observed between Scenario 1 and the other two scenarios.
23