
Page 214 - Littleton, CO Comprehensive Plan
P. 214
Fiscal Impact Analysis
The City of Littleton, CO
AVERAGE ANNUAL NET FISCAL IMPACTS
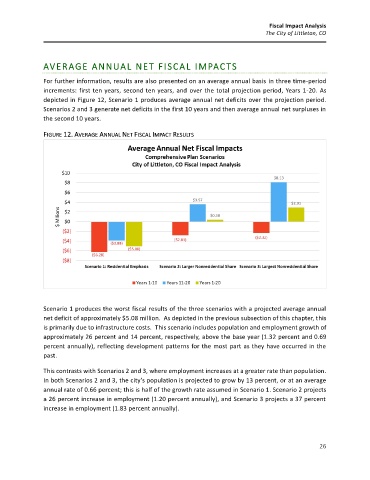
For further information, results are also presented on an average annual basis in three time-period
increments: first ten years, second ten years, and over the total projection period, Years 1-20. As
depicted in Figure 12, Scenario 1 produces average annual net deficits over the projection period.
Scenarios 2 and 3 generate net deficits in the first 10 years and then average annual net surpluses in
the second 10 years.
FIGURE 12. AVERAGE ANNUAL NET FISCAL IMPACT RESULTS
Scenario 1 produces the worst fiscal results of the three scenarios with a projected average annual
net deficit of approximately $5.08 million. As depicted in the previous subsection of this chapter, this
is primarily due to infrastructure costs. This scenario includes population and employment growth of
approximately 26 percent and 14 percent, respectively, above the base year (1.32 percent and 0.69
percent annually), reflecting development patterns for the most part as they have occurred in the
past.
This contrasts with Scenarios 2 and 3, where employment increases at a greater rate than population.
In both Scenarios 2 and 3, the city’s population is projected to grow by 13 percent, or at an average
annual rate of 0.66 percent; this is half of the growth rate assumed in Scenario 1. Scenario 2 projects
a 26 percent increase in employment (1.20 percent annually), and Scenario 3 projects a 37 percent
increase in employment (1.83 percent annually).
26