
Page 218 - Littleton, CO Comprehensive Plan
P. 218
Fiscal Impact Analysis
The City of Littleton, CO
FURTHER DETAIL ON OP ERATING AND CAPITAL RESULTS
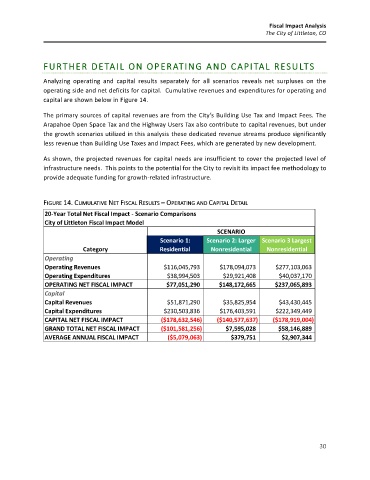
Analyzing operating and capital results separately for all scenarios reveals net surpluses on the
operating side and net deficits for capital. Cumulative revenues and expenditures for operating and
capital are shown below in Figure 14.
The primary sources of capital revenues are from the City’s Building Use Tax and Impact Fees. The
Arapahoe Open Space Tax and the Highway Users Tax also contribute to capital revenues, but under
the growth scenarios utilized in this analysis these dedicated revenue streams produce significantly
less revenue than Building Use Taxes and Impact Fees, which are generated by new development.
As shown, the projected revenues for capital needs are insufficient to cover the projected level of
infrastructure needs. This points to the potential for the City to revisit its impact fee methodology to
provide adequate funding for growth-related infrastructure.
FIGURE 14. CUMULATIVE NET FISCAL RESULTS – OPERATING AND CAPITAL DETAIL
20-Year Total Net Fiscal Impact - Scenario Comparisons
City of Littleton Fiscal Impact Model
SCENARIO
Scenario 1: Scenario 2: Larger Scenario 3 Largest
Category Residential Nonresidential Nonresidential
Operating
Operating Revenues $116,045,793 $178,094,073 $277,103,063
Operating Expenditures $38,994,503 $29,921,408 $40,037,170
OPERATING NET FISCAL IMPACT $77,051,290 $148,172,665 $237,065,893
Capital
Capital Revenues $51,871,290 $35,825,954 $43,430,445
Capital Expenditures $230,503,836 $176,403,591 $222,349,449
CAPITAL NET FISCAL IMPACT ($178,632,546) ($140,577,637) ($178,919,004)
GRAND TOTAL NET FISCAL IMPACT ($101,581,256) $7,595,028 $58,146,889
AVERAGE ANNUAL FISCAL IMPACT ($5,079,063) $379,751 $2,907,344
30