
Page 223 - Littleton, CO Comprehensive Plan
P. 223
Fiscal Impact Analysis
The City of Littleton, CO
REVENUE PROJECTIONS
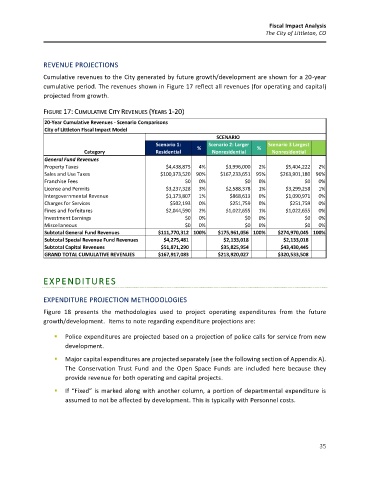
Cumulative revenues to the City generated by future growth/development are shown for a 20-year
cumulative period. The revenues shown in Figure 17 reflect all revenues (for operating and capital)
projected from growth.
FIGURE 17: CUMULATIVE CITY REVENUES (YEARS 1-20)
20-Year Cumulative Revenues - Scenario Comparisons
City of Littleton Fiscal Impact Model
SCENARIO
Scenario 1: Scenario 2: Larger Scenario 3 Largest
% %
Category Residential Nonresidential Nonresidential
General Fund Revenues
Property Taxes $4,438,875 4% $3,996,000 2% $5,404,222 2%
Sales and Use Taxes $100,373,520 90% $167,233,651 95% $263,901,180 96%
Franchise Fees $0 0% $0 0% $0 0%
License and Permits $3,237,328 3% $2,588,378 1% $3,299,258 1%
Intergovernmental Revenue $1,173,807 1% $868,613 0% $1,090,971 0%
Charges for Services $502,193 0% $251,759 0% $251,759 0%
Fines and Forfeitures $2,044,590 2% $1,022,655 1% $1,022,655 0%
Investment Earnings $0 0% $0 0% $0 0%
Miscellaneous $0 0% $0 0% $0 0%
Subtotal General Fund Revenues $111,770,312 100% $175,961,056 100% $274,970,045 100%
Subtotal Special Revenue Fund Revenues $4,275,481 $2,133,018 $2,133,018
Subtotal Capital Revenues $51,871,290 $35,825,954 $43,430,445
GRAND TOTAL CUMULATIVE REVENUES $167,917,083 $213,920,027 $320,533,508
EXPENDITURES
EXPENDITURE PROJECTION METHODOLOGIES
Figure 18 presents the methodologies used to project operating expenditures from the future
growth/development. Items to note regarding expenditure projections are:
▪ Police expenditures are projected based on a projection of police calls for service from new
development.
▪ Major capital expenditures are projected separately (see the following section of Appendix A).
The Conservation Trust Fund and the Open Space Funds are included here because they
provide revenue for both operating and capital projects.
▪ If “Fixed” is marked along with another column, a portion of departmental expenditure is
assumed to not be affected by development. This is typically with Personnel costs.
35