
Page 221 - Littleton, CO Comprehensive Plan
P. 221
Fiscal Impact Analysis
The City of Littleton, CO
A P PENDIX A: REVENUE AND COST DETAIL
A summary of projected revenues and costs from future growth/development in the city is provided
below. These figures are based on the development projections and the revenue and cost factors
described elsewhere in this report.
REVENUES
REVENUE PROJECTION METHODOLOGIES
City General Fund revenues are projected from future growth. A summary of projection
methodologies is shown in Figure 15.
Other items to note regarding revenue projections are:
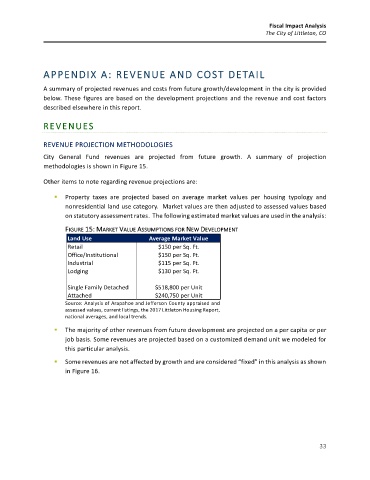
▪ Property taxes are projected based on average market values per housing typology and
nonresidential land use category. Market values are then adjusted to assessed values based
on statutory assessment rates. The following estimated market values are used in the analysis:
FIGURE 15: MARKET VALUE ASSUMPTIONS FOR NEW DEVELOPMENT
Land Use Average Market Value
Retail $150 per Sq. Ft.
Office/Institutional $150 per Sq. Ft.
Industrial $115 per Sq. Ft.
Lodging $130 per Sq. Ft.
Single Family Detached $518,800 per Unit
Attached $240,750 per Unit
Source: Analysis of Arapahoe and Jefferson County appraised and
assessed values, current listings, the 2017 Littleton Housing Report,
national averages, and local trends.
▪ The majority of other revenues from future development are projected on a per capita or per
job basis. Some revenues are projected based on a customized demand unit we modeled for
this particular analysis.
▪ Some revenues are not affected by growth and are considered “fixed” in this analysis as shown
in Figure 16.
33