
Page 216 - Littleton, CO Comprehensive Plan
P. 216
Fiscal Impact Analysis
The City of Littleton, CO
CUMULATIVE NET FISCAL IMPACTS
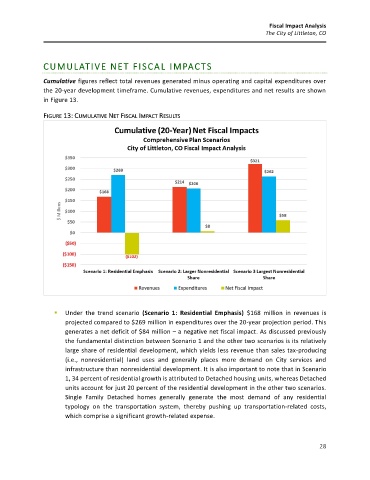
Cumulative figures reflect total revenues generated minus operating and capital expenditures over
the 20-year development timeframe. Cumulative revenues, expenditures and net results are shown
in Figure 13.
FIGURE 13: CUMULATIVE NET FISCAL IMPACT RESULTS
▪ Under the trend scenario (Scenario 1: Residential Emphasis) $168 million in revenues is
projected compared to $269 million in expenditures over the 20-year projection period. This
generates a net deficit of $84 million – a negative net fiscal impact. As discussed previously
the fundamental distinction between Scenario 1 and the other two scenarios is its relatively
large share of residential development, which yields less revenue than sales tax-producing
(i.e., nonresidential) land uses and generally places more demand on City services and
infrastructure than nonresidential development. It is also important to note that in Scenario
1, 34 percent of residential growth is attributed to Detached housing units, whereas Detached
units account for just 20 percent of the residential development in the other two scenarios.
Single Family Detached homes generally generate the most demand of any residential
typology on the transportation system, thereby pushing up transportation-related costs,
which comprise a significant growth-related expense.
28