
Page 212 - Littleton, CO Comprehensive Plan
P. 212
Fiscal Impact Analysis
The City of Littleton, CO
ANNUAL OPERATING AND CAPITAL EXPENDITURES COMPARED TO REVENUES
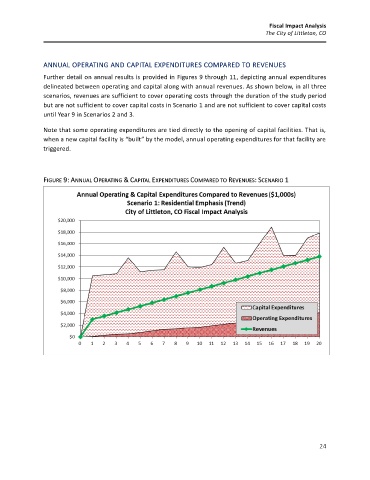
Further detail on annual results is provided in Figures 9 through 11, depicting annual expenditures
delineated between operating and capital along with annual revenues. As shown below, in all three
scenarios, revenues are sufficient to cover operating costs through the duration of the study period
but are not sufficient to cover capital costs in Scenario 1 and are not sufficient to cover capital costs
until Year 9 in Scenarios 2 and 3.
Note that some operating expenditures are tied directly to the opening of capital facilities. That is,
when a new capital facility is “built” by the model, annual operating expenditures for that facility are
triggered.
FIGURE 9: ANNUAL OPERATING & CAPITAL EXPENDITURES COMPARED TO REVENUES: SCENARIO 1
24