
Page 229 - Littleton, CO Comprehensive Plan
P. 229
Fiscal Impact Analysis
The City of Littleton, CO
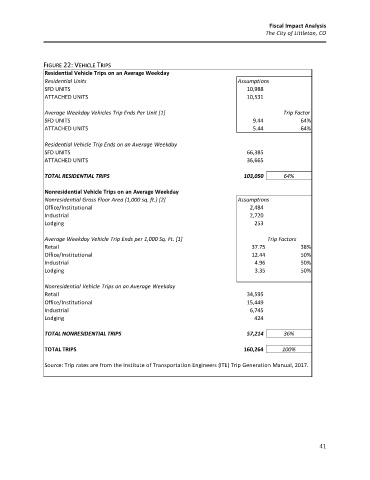
FIGURE 22: VEHICLE TRIPS
Residential Vehicle Trips on an Average Weekday
Residential Units Assumptions
SFD UNITS 10,988
ATTACHED UNITS 10,531
Average Weekday Vehicles Trip Ends Per Unit [1] Trip Factor
SFD UNITS 9.44 64%
ATTACHED UNITS 5.44 64%
Residential Vehicle Trip Ends on an Average Weekday
SFD UNITS 66,385
ATTACHED UNITS 36,665
TOTAL RESIDENTIAL TRIPS 103,050 64%
Nonresidential Vehicle Trips on an Average Weekday
Nonresidential Gross Floor Area (1,000 sq. ft.) [2] Assumptions
Office/Institutional 2,484
Industrial 2,720
Lodging 253
Average Weekday Vehicle Trip Ends per 1,000 Sq. Ft. [1] Trip Factors
Retail 37.75 38%
Office/Institutional 12.44 50%
Industrial 4.96 50%
Lodging 3.35 50%
Nonresidential Vehicle Trips on an Average Weekday
Retail 34,595
Office/Institutional 15,449
Industrial 6,745
Lodging 424
TOTAL NONRESIDENTIAL TRIPS 57,214 36%
TOTAL TRIPS 160,264 100%
Source: Trip rates are from the Institute of Transportation Engineers (ITE) Trip Generation Manual, 2017.
41