
Page 84 - Florence County, SC Florence County 2032: Connecting Our Past, Defining Our Future
P. 84
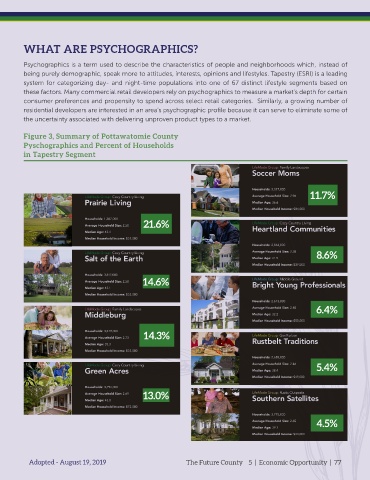
WHAT ARE PSYCHOGRAPHICS?
Psychographics is a term used to describe the characteristics of people and neighborhoods which, instead of
being purely demographic, speak more to attitudes, interests, opinions and lifestyles. Tapestry (ESRI) is a leading
system for categorizing day- and night-time populations into one of 67 distinct lifestyle segments based on
these factors. Many commercial retail developers rely on psychographics to measure a market’s depth for certain
consumer preferences and propensity to spend across select retail categories. Similarly, a growing number of
residential developers are interested in an area’s psychographic profile because it can serve to eliminate some of
the uncertainty associated with delivering unproven product types to a market.
Figure 3, Summary of Pottawatomie County
Pyschographics and Percent of Households
in Tapestry Segment
LifeMode Group: Family Landscapes 4A
Soccer Moms
Households: 3,327,000
LifeMode Group: Cozy Country Living 6D Average Household Size: 2.96 11.7%
Prairie Living Median Age: 36.6
Median Household Income: $84,000
Households: 1,307,000
Average Household Size: 2.50 21.6% LifeMode Group: Cozy Country Living 6F
SOCIOECONOMIC TRAITS
OUR NEIGHBORHOOD
WHO ARE WE? Heartland Communities
Median Age: 43.4 Soccer Moms is an affl uent, family-oriented market • Soccer Moms residents prefer the suburban • Education: 37.7% college graduates; more
with a country fl avor. Residents are partial to new housing periphery of metropolitan areas. than 70% with some college education.
Median Household Income: $51,000 away from the bustle of the city but close enough to
commute to professional job centers. Life in this suburban • Predominantly single family, homes are in • Low unemployment at 5.9%; high labor
force participation rate at 72%; 2 out of 3
newer neighborhoods, 36% built in the
Households: 2,864,000
wilderness offsets the hectic pace of two working parents 1990s (Index 253), 31% built since 2000. households include 2+ workers (Index 124).
with growing children. They favor time-saving devices,
• Connected, with a host of wireless devices
• Owner-occupied homes have high rate of
like banking online or housekeeping services, and
LifeMode Group: Cozy Country Living 6B Average Household Size: 2.38 8.6%
mortgages at 74% (Index 163), and low rate
from iPods to tablets—anything that
vacancy at 5%.
WHO ARE WE? Salt of the Earth SOCIOECONOMIC TRAITS family-oriented pursuits. Median Age: 41.5 enables convenience, like banking,
OUR NEIGHBORHOOD
Prairie Living is Tapestry Segmentation’s most rural market, • About four-fi fths of households are • Half have completed some college • Median home value is $226,000. paying bills, or even shopping online.
comprising about 1 percent of households, located mainly owner occupied. education or hold a degree. Median Household Income: $39,000 • Well insured and invested in a range of
• Most households are married couples
in the Midwest, with a predominance of self-employed • Dominant household type is • At 4.1%, the unemployment rate is less with children; average household size is 2.96. funds, from savings accounts or bonds
farmers. These agricultural communities are not diverse, married-couples with no children. than half the US rate. • Most households have 2 or 3 vehicles; to stocks.
Households: 3,517,000
dominated by married-couple families that own single-family long travel time to work including a • Carry a higher level of debt, including
14.6%
dwellings and many vehicles. Median household income is • Most are single-family homes (87%) built • Labor force participation rate slightly LifeMode Group: Middle Ground fi rst (Index 159) and second mortgages
8C
disproportionate number commuting
Average Household Size: 2.58
similar to the US, and labor force participation is slightly before 1980; a higher proportion were built higher at 66%. from a different county (Index 133). (Index 154) and auto loans (Index 151).
OUR NEIGHBORHOOD
SOCIOECONOMIC TRAITS
higher. Faith is important to this hardworking market. When before 1940 (Index 225). • Wage and salary income for 73% of WHO ARE WE? Bright Young Professionals
Median Age: 43.1
they fi nd time to relax, they favor outdoor activities. • Higher percentage of vacant housing households plus self-employment Well settled and close-knit, Heartland Communities are • Rural communities or small towns • Retirees in this market depress the average labor
TAPESTRY
TM
units is at 16% (Index 137). income for 27% (Index 242). semirural and semiretired. These older householders are are concentrated in the Midwest, force participation rate to less than 60% (Index 95),
SEGMENTATION
Median Household Income: $53,000 • Faith and religion are important primarily homeowners, and many have paid off their from older Rustbelt cities to but the unemployment rate is comparable to the US.
• Most households own 2 or 3 vehicles;
esri.com/tapestry
Note: The Index represents the ratio of the segment rate to the US rate multiplied by 100.
this is the highest ranked market for to these residents. mortgages. Their children have moved away, but they have the Great Plains. • More workers are white collar than blue collar;
Consumer preferences are estimated from data by GfK MRI.
Households: 2,613,000
owning 4 or more vehicles. • Tend to buy things when they need no plans to leave their homes. Their hearts are with the • Distribution of household types is more skilled than unskilled.
6.4%
them, rather than when they want them country; they embrace the slower pace of life here but comparable to the US, primarily (but • The rural economy of this market provides
Average Household Size: 2.40
LifeMode Group: Family Landscapes or to be trendy. actively participate in outdoor activities and community not the majority) married couples, employment in the manufacturing, construction,
events. Traditional and patriotic, these residents support
more with no children, and a
OUR NEIGHBORHOOD
WHO ARE WE? Middleburg SOCIOECONOMIC TRAITS 4C Median Age: 32.2 and agriculture industries.
• Somewhat resistant to new technology. their local businesses, always buy American, and favor
slightly higher proportion of singles
TAPESTRY
Salt of the Earth residents are entrenched in their traditional, • This large segment is concentrated in the • Creatures of habit when purchasing domestic driving vacations over foreign plane trips. Median Household Income: $50,000 • These are budget savvy consumers; they stick to
• Steady employment in construction,
TM
(Index 112) that refl ects the aging
manufacturing, and related service industries.
rural lifestyles. Citizens here are older, and many have Midwest, particularly in Ohio, Pennsylvania, food items. of the population. brands they grew up with and know the price of
SEGMENTATION
grown children that have moved away. They still cherish and Indiana. • Completed education: 42% with a • Residents own modest, goods they purchase. Buying American is important.
esri.com/tapestry
family time and also tending to their vegetable gardens • Due to their rural setting, households own Note: The Index represents the ratio of the segment rate to the US rate multiplied by 100. single-family homes built • Daily life is busy, but routine. Working on the
Consumer preferences are estimated from data by GfK MRI.
high school diploma only.
Households: 3,319,000
and preparing homemade meals. Residents embrace the two vehicles to cover their long commutes, before 1970. weekends is not uncommon.
• Household income just over the
outdoors; they spend most of their free time preparing for often across county boundaries. 14.3% LifeMode Group: GenXurban • Residents trust TV and newspapers more than
Average Household Size: 2.73
their next fi shing, boating, or camping trip. The majority has national median, while net worth is • They own one or two vehicles; any other media. 5D
OUR NEIGHBORHOOD
commutes are short (Index 95).
at least a high school diploma or some college education; • Home ownership rates are very high double the national median. WHO ARE WE? Rustbelt Traditions SOCIOECONOMIC TRAITS
• Skeptical about their fi nancial future, they stick
many have expanded their skill set during their years of (Index 132). Single-family homes are • Spending time with family their top priority. TAPESTRY TM • Approximately 56% of the households rent; • Education completed: 36% with some
Median Age: 35.3
Bright Young Professionals is a large market, primarily
employment in the manufacturing and related industries. They affordable, valued at 25 percent less • Cost-conscious consumers, loyal to brands 44% own their homes. to community banks and low-risk investments.
college or an associate’s degree, 30% with
located in urban outskirts of large metropolitan areas.
may be experts with DIY projects, but the latest technology than the national market. they like, with a focus on buying American. SEGMENTATION a bachelor’s degree or higher. Education
Median Household Income: $55,000
These communities are home to young, educated, working
esri.com/tapestry
is not their forte. They use it when absolutely necessary, • Two in three households are composed professionals. One out of three householders is under • Household type is primarily couples, Note: The Index represents the ratio of the segment rate to the US rate multiplied by 100.
in progress is 10% (Index 127).
Consumer preferences are estimated from data by GfK MRI.
married (or unmarried), with above
but seek face-to-face contact in their routine activities. of married couples; less than half have • Last to buy the latest and greatest products. Households: 2,685,000
the age of 35. Slightly more diverse couples dominate
children at home. • Try to eat healthy, tracking the nutrition this market, with more renters than homeowners. More average concentrations of both • Unemployment rate is lower at 7.1%,
single-parent (Index 125) and
and ingredients in the food they purchase. Average Household Size: 2.46 and labor force participation rate of 73%
than two-fi fths of the households live in single-family
LifeMode Group: Cozy Country Living 6A • Multiunit buildings or row housing 5.4%
single-person (Index 115) households.
is higher than the US rate.
homes; over a third live in 5+ unit buildings. Labor force
Median Age: 38.4
WHO ARE WE? Green Acres SOCIOECONOMIC TRAITS participation is high, generally white-collar work, with a make up 55% of the housing stock (row • These consumers are up on the
OUR NEIGHBORHOOD
latest technology.
mix of food service and part-time jobs (among the college
TAPESTRY
TM
Middleburg neighborhoods transformed from the easy • Semirural locales within metropolitan areas. • Education: 66% with a high school diploma housing (Index 182), buildings with
Median Household Income: $49,000
pace of country living to semirural subdivisions in the last • Neighborhoods changed rapidly in the or some college. students). Median household income, median home value, 5–19 units (Index 277)); 44% built 1980–99. • They get most of their information from
SEGMENTATION
and average rent are close to the US values. Residents
the Internet.
decade, when the housing boom reached out. Residents previous decade with the addition of • Unemployment rate lower at 7.4% of this segment are physically active and up on the • Average rent is slightly higher than
esri.com/tapestry
Note: The Index represents the ratio of the segment rate to the US rate multiplied by 100.
are conservative, family-oriented consumers. Still more new single-family homes. (Index 85). latest technology. • Concern about the environment,
Consumer preferences are estimated from data by GfK MRI.
Households: 3,794,000
country than rock and roll, they are thrifty but willing to the US (Index 102). impacts their purchasing decisions.
carry some debt and are already investing in their futures. • Include a number of mobile homes • Labor force participation typical of a • Lower vacancy rate is at 8.9%.
younger population at 66.7% (Index 106).
Average Household Size: 2.69
They rely on their smartphones and mobile devices to stay (Index 152). 13.0% LifeMode Group: Rustic Outposts 10A
The backbone of older industrial cities in states Southern Satellites
in touch and pride themselves on their expertise. They • Affordable housing, median value of • Traditional values are the norm here— WHO ARE WE? OUR NEIGHBORHOOD SOCIOECONOMIC TRAITS
Median Age: 43.0
prefer to buy American and travel in the US. This market $158,000 (Index 89) with a low vacancy rate. faith, country, and family. TAPESTRY TM • Almost half (46%) of the households are married-couple • Most have graduated from high school or
is younger but growing in size and assets. • Young couples, many with children; • Prefer to buy American and for a surrounding the Great Lakes, Rustbelt Traditions families, similar to the US (48%), most without children spent some time at a college or university.
SEGMENTATION
Median Household Income: $72,000 good price. residents are a mix of married-couple families (also similar to the US); the slightly higher proportion • Unemployment below the US at 8%;
average household size is 2.73.
esri.com/tapestry
Note: The Index represents the ratio of the segment rate to the US rate multiplied by 100.
and singles living in older developments of
Consumer preferences are estimated from data by GfK MRI.
• Comfortable with the latest in technology, of singles (Index 105) reflects the aging of the population. labor force participation slightly higher
single-family homes. While varied, the work
for convenience (online banking or saving Households: 3,775,000 than the US at 67%.
• Average household size is slightly lower at 2.46.
money on landlines) and entertainment. force is primarily white collar, with a higher • They are movers, slightly more mobile than the US • While most income derived from wages
concentration of skilled workers in manufacturing, Average Household Size: 2.65
population (Index 109), but almost half of householders
and salaries, nearly 30% of households
retail trade, and health care. Rustbelt Traditions (46%) moved into their current homes before 2000. 4.5%
WHO ARE WE? OUR NEIGHBORHOOD SOCIOECONOMIC TRAITS represents a large market of stable, hard-working Median Age: 39.7 collecting Social Security and nearly 20%
TAPESTRY
TM
The Green Acres lifestyle features country living and • Rural enclaves in metropolitan areas, • Education: 60% are college educated. consumers with modest incomes but above • Most residents live in modest, single-family homes in drawing income from retirement accounts.
older neighborhoods built in the 1950s (Index 218).
self-reliance. They are avid do-it-yourselfers, maintaining primarily (not exclusively) older homes • Unemployment is low at 6% (Index 70); average net worth (Index 111). Family oriented, Median Household Income: $44,000 • Family-oriented consumers who value
SEGMENTATION
they value time spent at home. Most have lived,
and remodeling their homes, with all the necessary power with acreage; new housing growth in labor force participation rate is high at 67.4% • Nearly three quarters own their homes; over half of time spent at home.
esri.com/tapestry
Note: The Index represents the ratio of the segment rate to the US rate multiplied by 100.
tools to accomplish the jobs. Gardening, especially growing the past 10 years. (Index 108). worked, and played in the same area for years. households have mortgages. • Most lived, worked, and played in
Consumer preferences are estimated from data by GfK MRI.
vegetables, is also a priority, again with the right tools, tillers, • Single-family, owner-occupied housing, • A large and growing market, Rustbelt Traditions the same area for years.
tractors, and riding mowers. Outdoor living also features a with a median value of $197,000. • Income is derived not only from wages and salaries residents are located in the dense urban fringe of • Budget aware shoppers that favor
variety of sports: hunting and fi shing, motorcycling, hiking but also from self-employment (more than 15% metropolitan areas throughout the Midwest and South. American-made products.
WHO ARE WE?
and camping, and even golf. Self-described conservatives, • An older market, primarily married of households), investments (30% of households), OUR NEIGHBORHOOD SOCIOECONOMIC TRAITS
• Most households have two or more vehicles available.
residents of Green Acres remain pessimistic about the couples, most with no children. and increasingly, from retirement. Southern Satellites is the second largest market found • About 79% of households are owned. • Read newspapers, especially the
TAPESTRY
TM
• Education: almost 40% have a high school
Sunday editions.
near future yet are heavily invested in it.
Adopted - August 19, 2019 • They are cautious consumers with a focus on SEGMENTATION • Married couples with no children are diploma only (Index 137); 41% have college
| 77
The Future County 5 | Economic Opportunity | 77
in rural settlements but within metropolitan areas located
quality and durability.
primarily in the South. This market is typically nondiverse,
Note: The Index represents the ratio of the segment rate to the US rate multiplied by 100.
• Comfortable with technology, more as a tool esri.com/tapestry the dominant household type, with a education (Index 72).
Consumer preferences are estimated from data by GfK MRI.
slightly older, settled married-couple families, who
than a trend: banking or paying bills online is number of multigenerational households • Unemployment rate is 9.2%, slightly higher
own their homes. Almost two-thirds of the homes are
convenient; but the Internet is not viewed single-family structures; a third are mobile homes. (Index 112). than the US rate.
as entertainment. Median household income and home value are below • Most are single-family homes (65%), with a • Labor force participation rate is 59.7%,
average. Workers are employed in a variety of industries,
• Economic outlook is professed as pessimistic, but number of mobile homes (Index 523). slightly lower than the US.
such as manufacturing, health care, retail trade, and
consumers are comfortable with debt, primarily • Most housing units were built in • These consumers are more concerned
TAPESTRY TM as home and auto loans, and investments. construction, with higher proportions in mining and 1970 or later. about cost rather than quality or
SEGMENTATION agriculture than the US. Residents enjoy country living, • Most households own 1 or 2 vehicles, but brand loyalty.
preferring outdoor activities and DIY home projects.
esri.com/tapestry Note: The Index represents the ratio of the segment rate to the US rate multiplied by 100. owning 3+ vehicles is common (Index 146). • They tend to be somewhat late in adapting
Consumer preferences are estimated from data by GfK MRI. to technology.
• They obtain a disproportionate amount of
their information from TV, compared to
other media.
TAPESTRY TM
SEGMENTATION
PLAN POTTAWATOMIE COUNTY 2040
esri.com/tapestry Note: The Index represents the ratio of the segment rate to the US rate multiplied by 100.
Consumer preferences are estimated from data by GfK MRI.